


Gold trading strategies: optimize risk and returns in 2026
- Shannon B
- Mar 26
- 8 min read


Record-breaking ETF inflows of $19bn in January 2026 alone signal that major institutions are no longer treating gold as a fringe allocation. Central banks are buying at scale, de-dollarization is accelerating, and sophisticated portfolios are being restructured around precious metals. Yet many institutional investors and high-net-worth individuals still lack a clear, evidence-backed framework for selecting and executing gold trading strategies in this environment. This article cuts through the noise and gives you a precise, actionable roadmap for 2026.
Table of Contents
Key Takeaways
Point | Details |
Institutional gold demand | ETF inflows and central bank buying are rapidly increasing gold’s allocation in 2026. |
Strategic allocations | A core 1-3% in physical-backed ETFs and 2-5% in miners fits varying risk profiles. |
Risk management essentials | Diversification, sizing, and vehicle choice are key to managing volatility and operational risks. |
2026 market outlook | Major banks forecast gold over $5000/oz, influenced by macro trends and central bank activity. |
Why gold is surging among institutional investors in 2026
The surge in gold allocations is not speculative enthusiasm. It reflects a calculated response to structural macro shifts that are reshaping how capital is deployed globally. Understanding these drivers is the first step toward building a position that holds up under pressure.
ETF inflows and central bank purchases averaging 585 tonnes quarterly have created a demand floor that is difficult to ignore. Institutions are not chasing momentum. They are responding to persistent inflation, currency debasement risk, and the erosion of confidence in sovereign debt markets. Gold is filling a structural gap in portfolios that traditional fixed income can no longer fill.
Several macro themes are converging to make gold a priority allocation in 2026:
De-dollarization: Emerging market central banks are actively reducing USD reserves and replacing them with gold.
Inflation hedging: Real yields remain suppressed, making gold a compelling store of value relative to bonds.
Volatility management: Gold’s low correlation to equities provides genuine diversification when equity markets are stressed.
Liquidity: The gold market trades over $200 billion daily, giving institutions the depth they need to enter and exit positions efficiently.
Tactical opportunities: Price momentum and options markets offer additional return layers beyond passive holding.
As the World Gold Council data consistently shows, gold’s role in institutional portfolios has evolved from a crisis hedge to a core strategic asset. This is a meaningful distinction. A crisis hedge gets added when fear spikes. A core strategic asset gets sized deliberately and held through cycles.
“Gold is no longer a peripheral allocation for institutions. In 2026, it represents a deliberate, multi-function position that addresses inflation, currency risk, and portfolio volatility simultaneously.”
If you want a deeper look at why gold matters in 2026 from a portfolio construction standpoint, the macro case is even more compelling when you examine the data behind central bank reserve diversification. For a full breakdown of the key gold trading factors in 2026, including geopolitical drivers and supply constraints, the picture becomes sharper still.
Core gold trading strategies for 2026
With institutional demand as the backdrop, the next decision is which strategy fits your risk profile and capital objectives. There is no single correct approach. The right strategy depends on your time horizon, liquidity needs, and tolerance for volatility.
Three primary frameworks dominate institutional gold trading in 2026:
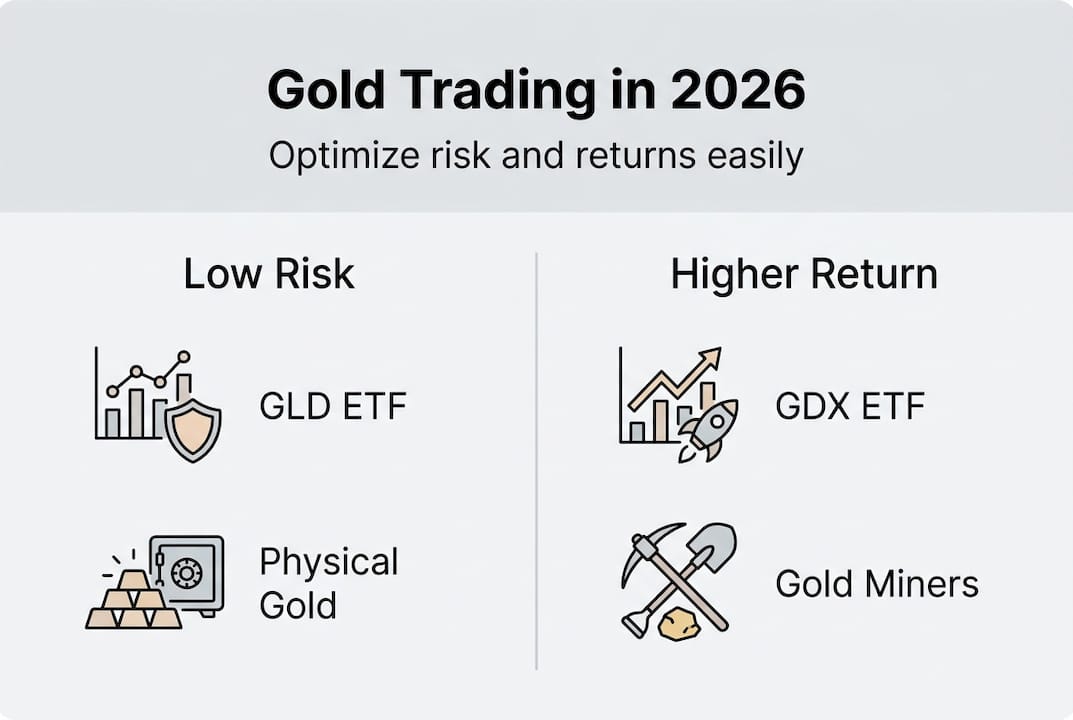
Core allocation uses physical-backed ETFs like GLD as a stable, low-cost foundation. This is the anchor of the portfolio, sized for long-term holding with minimal turnover. Tactical allocation adds exposure through GDX (a miners ETF) to capture leverage to gold price moves, accepting higher volatility in exchange for amplified upside. Tiered allocation combines both approaches, adjusting the ratio based on risk profile and market conditions.
Understanding the difference between GLD and GDX is critical. GLD tracks the spot price of gold directly, backed by physical bullion held in vaults. GDX holds shares in gold mining companies, which means its performance is influenced by operational costs, management quality, and equity market sentiment, not just gold prices. GDX can outperform GLD sharply in a bull market but also underperform significantly when miners face cost pressures or equity markets sell off broadly.

Recommended institutional allocations suggest 1 to 3% core in GLD for stability and 2 to 5% tactical in GDX for leverage. The tiered allocation approach by risk profile breaks down as follows:
Risk profile | Physical gold / GLD | GDX / miners | Total gold allocation |
Conservative | 70 to 85% | 15 to 30% | 5 to 7% of portfolio |
Balanced | 50 to 70% | 30 to 50% | 7 to 10% of portfolio |
Aggressive | 30 to 50% | 50 to 70% | 10 to 15% of portfolio |
This table reflects the core principle: as risk appetite increases, you shift weight from stable physical exposure toward higher-beta mining equities. The total portfolio allocation also scales upward for those willing to accept more volatility in exchange for greater potential returns.
Pro Tip: Prioritize physical-backed ETFs for your core position to lock in gold’s diversification benefits without operational risk. Add miners only when you have a clear tactical thesis, such as a breakout in gold prices combined with compressed mining margins that are likely to expand.
For a step-by-step execution guide, the gold trading step-by-step resource walks through order sizing, vehicle selection, and custodian considerations in detail. If you need to get up to speed on terminology before executing, the gold trading terminology guide covers every key concept used in institutional gold markets.
Risk management: Volatility, allocation, and diversification
A well-chosen strategy is only as strong as the risk management framework supporting it. In gold trading, the risks are real and varied. Ignoring them is how disciplined capital gets eroded.
Here is a direct comparison of the risk and return characteristics across the main gold vehicles:
Vehicle | Volatility | Liquidity | Operational risk | Leverage to gold |
Physical gold | Low | Medium | Low | 1x |
GLD (physical ETF) | Low to medium | High | Very low | ~1x |
GDX (miners ETF) | High | High | Medium | 2x to 3x |
Individual mining stocks | Very high | Variable | High | 3x to 5x |
The risks in gold trading include price volatility, operational risks specific to mining companies, and the potential for speculative excess to distort valuations. Gold itself can decouple from miners during periods of equity market stress, meaning GDX can fall even when gold prices rise. This is a critical nuance that many investors underestimate.
Best practices for managing risk in a gold portfolio:
Size positions deliberately. Use the tiered allocation table above as a starting point, then adjust based on your portfolio’s existing volatility profile.
Diversify across vehicles. Do not concentrate entirely in miners or entirely in physical. A blend reduces single-point-of-failure risk.
Stress-test your allocation. Model how your gold position performs in a 2008-style equity selloff, a 2022-style rate spike, and a 2020-style liquidity crisis. Gold behaves differently in each scenario.
Monitor real yields and central bank flows. These are the two most reliable leading indicators for gold price direction. When real yields fall or central bank buying accelerates, gold tends to strengthen.
Review rebalancing triggers. Set clear thresholds, such as a 20% drift from target allocation, that automatically prompt a review.
“Gold’s low correlation to equities and bonds is not a marketing claim. It is a structural property of the asset that has held across multiple market cycles and remains one of the strongest arguments for its inclusion in institutional portfolios.”
The World Gold Council risk management framework supports a 5 to 10% strategic allocation to reduce overall portfolio volatility. This range is not arbitrary. It reflects the point at which gold’s diversification benefit is maximized without introducing excessive concentration risk.
Pro Tip: Track the 10-year TIPS yield (Treasury Inflation-Protected Securities) weekly. When real yields drop below zero, gold historically outperforms. This single indicator can help you time tactical additions to your gold position with far greater precision than price-based signals alone.
For a complete framework on gold portfolio risk management in 2026, including scenario analysis templates, the detail goes well beyond what a single article can cover. If you are building a case for investing in gold for diversification within a multi-asset mandate, the correlation data across asset classes makes a compelling argument.
2026 outlook: Price forecasts and practical implementation
Knowing the risk framework is essential. Knowing where prices are likely to go gives you the confidence to act on it.
The 2026 price forecasts from major banks are striking. Goldman Sachs forecasts gold at $4,900 to $5,400 per ounce by end-2026. JPMorgan’s range is even wider, projecting $5,000 to $6,300, driven primarily by central bank accumulation and accelerating de-dollarization trends. These are not fringe projections. They come from institutions with direct visibility into sovereign reserve flows and derivatives positioning.
Central bank action is the single most important variable in the 2026 gold market. When sovereign buyers are absorbing supply at scale, the price floor rises structurally. De-dollarization adds a second layer of demand that is largely insensitive to price, meaning it does not slow down when gold gets expensive. This combination creates a fundamentally different demand profile than what drove gold in previous cycles.
Here are the actionable steps for entering, scaling, and monitoring gold positions in 2026:
Establish your core position first. Allocate to GLD or physical gold before adding any tactical exposure. The core position is your anchor.
Scale into GDX tactically. Add miners exposure when gold is in a confirmed uptrend and mining margins are expanding. Do not chase miners in a late-stage rally.
Set price-based review triggers. If gold moves more than 15% in either direction within a quarter, review your allocation against your target.
Rebalance semi-annually at minimum. Gold’s strong performance in 2026 may cause it to drift above target weight, creating unintended concentration.
Document your thesis. Write down why you entered, what conditions would cause you to add, and what would cause you to reduce. This prevents emotional decision-making during volatile periods.
For a strategic view on trading gold for portfolio growth in 2026, the execution details matter as much as the macro thesis. Choosing the right vehicle, custodian, and reporting infrastructure is where institutional-grade execution separates itself from retail-grade exposure. A thorough review of gold trading platforms will help you identify which infrastructure best supports your compliance and reporting requirements.
How to access superior gold trading opportunities in 2026
You now have the strategies, the risk framework, and the market outlook. The missing piece is a platform built to execute at institutional standards.
Galami Gold is a physical gold trading platform built for disciplined execution, transparency, and efficient capital deployment across well-established gold supply chains. We work with institutional investors and high-net-worth individuals who require audited processes, clear reporting, and a counterparty they can trust. Our approach connects directly to the core and tactical allocation strategies covered in this article, giving you the infrastructure to implement what you have learned here with confidence. If you are ready to move from strategy to execution, explore our institutional gold trading guide and see how Galami Gold supports every stage of the investment process.
Frequently asked questions
What is the optimal percentage of gold for a 2026 institutional portfolio?
The World Gold Council recommends a 5 to 10% strategic allocation to reduce volatility, with tiered approaches adjusting the split between physical and miners based on your specific risk tolerance.
What is the difference between GLD and GDX for gold exposure?
GLD is a physical gold-backed ETF that tracks spot prices directly, making it ideal for stable core allocations. GDX holds gold mining equities, offering 2x to 3x leverage to gold prices with higher volatility and operational risk.
How do central bank actions affect gold prices in 2026?
Central bank purchases averaging 585 tonnes quarterly create a structural demand floor that supports higher prices, especially when combined with de-dollarization trends reducing USD reserve holdings.
What are the key risks in gold trading for 2026?
The primary risks are price volatility, leverage amplification in mining equities, operational risks tied to individual miners, and speculative excess that can distort valuations during late-stage rallies.
Recommended


Comments